
Sweet Insights
2023 State
of Treating
Supply chain disruption, 40-year high inflation and lingering COVID-19 concerns continued to affect confectionery shopping and consumption patterns. What did not change was the nation’s love for confectionery. Americans continued to treat themselves and others during seasonal and everyday occasions. Confectionery set new dollar sales records in 2022 — with gains far ahead of most other categories in the store. To maintain this strong momentum, NCA’s 2023 State of Treating report aims to bring a deep understanding of the confectionery consumer and market drivers to get a read on future patterns and demand.
Made Financially Possible By:
Salels Data Provided By:
2022 Category Sales Performance
In all channels, both measured and unmeasured, confectionery sales were as follows:

$23.9B
Chocolate
Total Sales
+

$15.4B
Non-Chocolate
Total Sales
+

$3.2B
Gum & Mints
Total Sales
=

$42.6B
Confectionery
Total Sales
Source: Euromonitor Projections as of December 2022
In IRI-measured channels only, growth for each segment was as follows:
9.1%
Chocolate
2022 Dollar Sales Growth
13.8%
Non-Chocolate
2022 Dollar Sales Growth
13.8%
Gum & Mints
2022 Dollar Sales Growth
Source: IRI, MULO+C, 52 weeks ending 1/1/2023
Category Permissibility
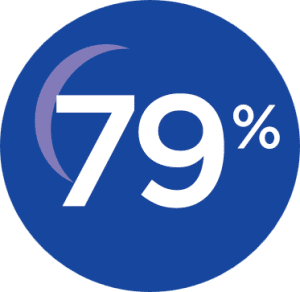
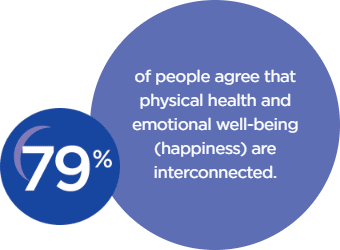
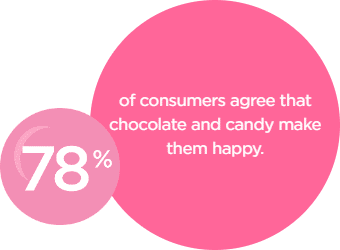
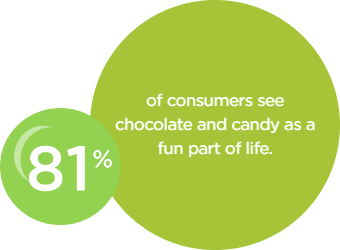
Candy sales grew in 2022 despite economic pressures by being…
- An affordable treat
- A beloved treat that makes people happy
- Highly permissible in a balanced lifestyle

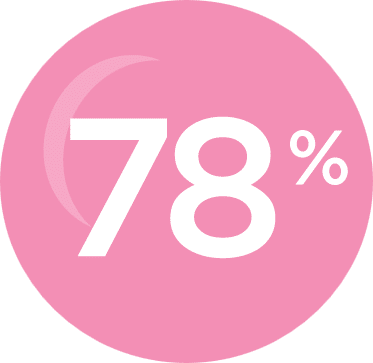
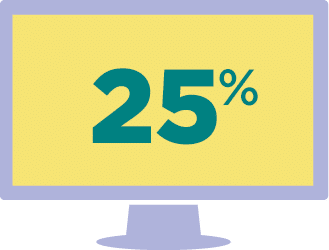
Brands offering portion size variety is of growing importance, according to candy shoppers.
69%
2021
78%
2023
NCA | State of Treating 2023
Confectionery Purchases & Innovation
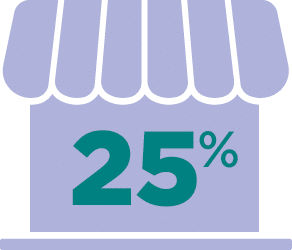
Consumers typically buy confectionery in three to four different channels, led by supercenters and supermarkets.
Supercenters
Supermarkets
Value Stores
Drug Stores
Club Stores
Convenience Stores

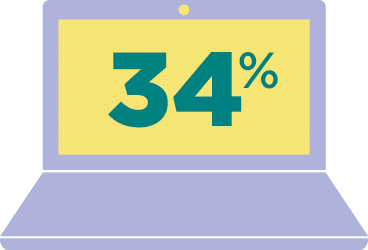
61 percent of shoppers occasionally or frequently look for confectionery products they have never purchased before.
Connecting With Consumers
Social Media
of active social media users have searched for confectionery-related content
Top Candy Searches:
Gifting Ideas
Baking with Chocolate/Candy
Serving/Presentation
Ideas

Crafting with Candy
Environmental, Social and Governance Efforts
Transparency is the currency of trust.
Top 5 preferred ways of learning about a brand’s ESG practices:
Package Label
Brand’s Website

Social Media
In-Store Signage
Store’s Website
Produced by:
 |
 |
Made financially possible by:
Sales data provided by:
Study Methodology
Shopper insights were collected using an online survey conducted in December 2022 among a national sample of 1,567 consumers between the ages of 18 and 75. The survey findings are overlaid with IRI retail measurement and household panel data. Future market predictions are provided by Euromonitor. The study was conducted by 210 Analytics, LLC. Unless otherwise attributed, data throughout this report are provided by NCA and 210 Analytics.


